Performance Measures
Key Stage 2 Results
| 2025 | % Age related or above |
% Higher Score / Greater Depth |
Average Scaled Score |
|---|---|---|---|
| Reading | |||
| King's Wood | 62 | 23 | 102.8 |
| National | 75 | 33 | 106.0 |
| Writing | |||
| King's Wood | 64 | 18 | / |
| National | 72 | 13 | / |
| Maths | |||
| King's Wood | 61 | 21 | 100.8 |
| National | 21 | 26 | 105.0 |
| R/W/M Combined | |||
| King's Wood | 54 | 11 | / |
| National | 62 | 8 | / |
Contextualising Our Performance Data
The School Inspection Data Summary Report (IDSR) helpfully provides information about the demographic we serve, compared with other schools nationally. It gives the following descriptions of our cohort:
-
Pupil Numbers: Well above average
-
Free School Meals (FSM): Above average
-
SEND Support: Well above average
-
EHCP (Education Health Care Plans): Above average
-
English as an Additional Language (EAL): Above average
-
School Stability: Below average (meaning more children join or leave our school mid-year than is typical)
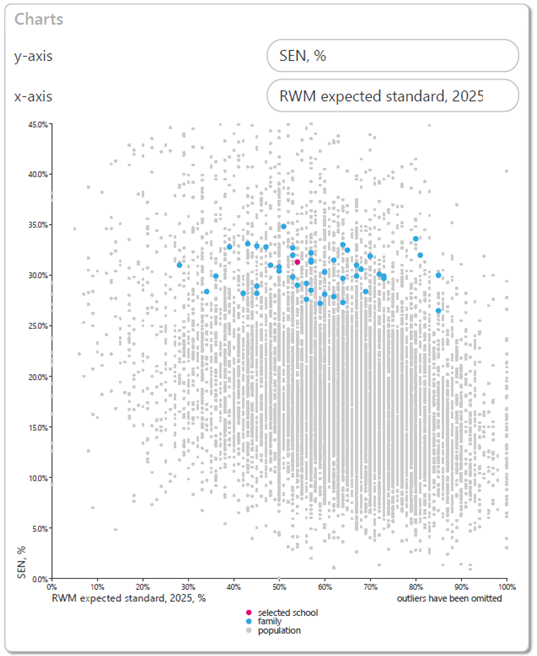
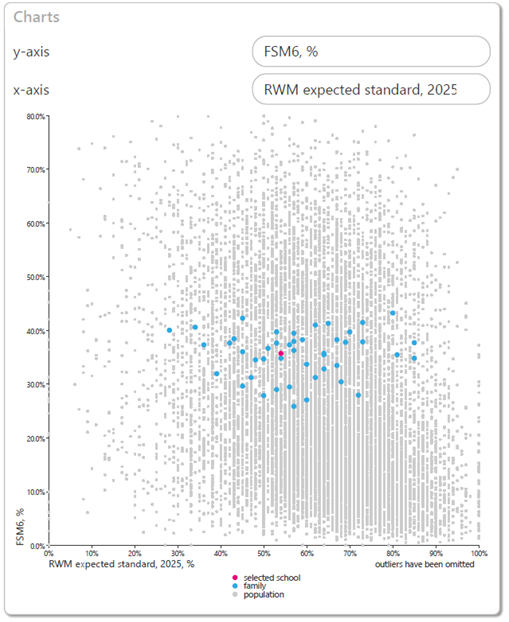
FFT Education Datalab is a high-profile, independent research team in the UK that specialises in the analysis of large-scale education datasets. Below are examples of comparison data. To find out more click here.
Graph showing similar schools combined 2025 KS2 SAT outcomes with comparable levels of SEN
Graph showing similar schools combined 2025 KS2 SAT outcomes with comparable levels of FSM6
Despite these contextual demands, our commitment to high standards is reflected in our upward trend data, which shows that King’s Wood is improving at a significantly faster rate than the national average.
Combined Reading, Writing, and Maths (Expected Standard)
-
Our Progress: Improved from 42% (2023) to 54% (2025).
-
The Impact: This is a 12-percentage point increase, far outstripping the national increase of just 2 percentage points over the same period.
Combined Reading, Writing, and Maths (Greater Depth)
-
Our Progress: Improved from 8% (2023) to 11% (2025).
-
The Impact: A 3-percentage point increase, achieved during a period where the national average for high attainment remained stagnant (0% increase).
We continue to drive improvements across the curriculum to ensure every child, regardless of their starting point, is prepared for the transition to Secondary School.
Performance Tables:
To compare King’s Wood with other schools locally and nationally, please visit the Department for Education’s performance tables.
To see our school's performance table, please click here.